
I have been through a lot of schooling. Some of it was a complete waste of time and utter nonsense. Some of it was useful. Thankfully, I am intellectually generous enough to share the highlights of my education so you all can be PhD-level thinkers without all the poverty-level stipends, rat bites, and bi-monthly existential crises.
I decided to write a series of short posts covering some of the most generally useful tools I learned to see through the b.s. when marketing companies, pop-science articles, politicians, and other ruffians present data in order to convince you of something.
This episode of Think Like a Scientist, let’s talk about y axes.
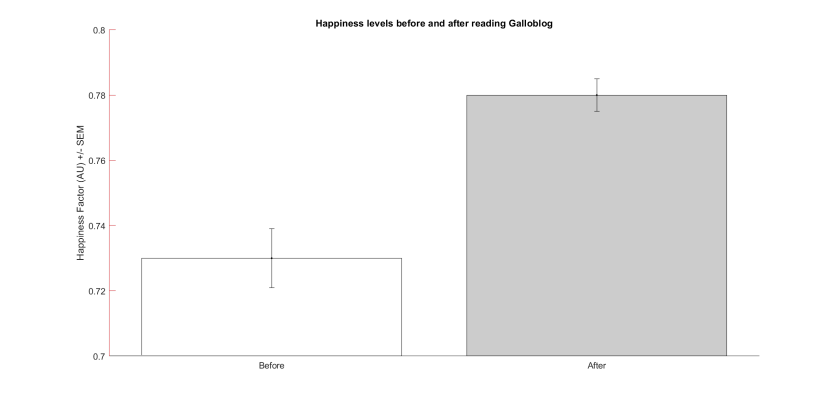
Okay, let’s set the scene. I’m the writer of Galloblog. I want you to read more Galloblog. In order to convince you, I throw this figure in your face –

Yowza! Pretty convincing, amiright?! Look how far apart those bars are! Reading Galloblog is equivalent to playing with puppies while eating peanut butter and listening to Tim Keller sermons!!
Or.. is it?!
Let me give you a few things to consider when you look at that figure.
Note the y axes (in red) is zoomed in to show 0.7 to 0.8. The more zoomed in, the more dramatic any differences between bars will look. Look at the figure below — far less impressive. Glancing at this figure, you may conclude that there are no differences at all, yes? But look! It’s the exact same data.
 Now, “zooming” in on the differences between groups isn’t always a shady scientific practice, but when evaluating the quality / importance of the data presented it’s important to have an understanding of what the possible range of scores actually is.
Ooo! I threw this in at the last minute for free! Something that drives me *insane* that I have seen far too many times in peer-reviewed scientific articles is showing two figures side by side – as a way to say “the difference between these two groups in this condition (in this example, reading Galloblog) is real and we want you to be impressed by this, but we don’t want you to be impressed by the difference between these two groups in this other condition (in this example, reading Matt Walsh’s blog)” – but with different y axes!

If you just glanced at the figures above, you would think – “Yowza! Galloblog readers are so much happier than Matt Walsh blog readers!”
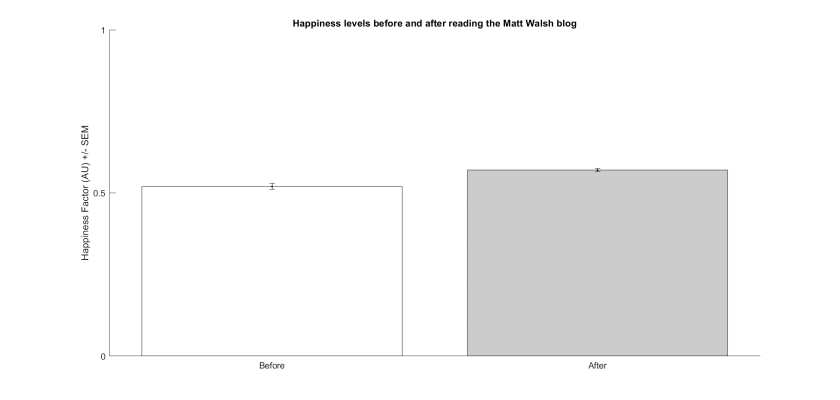
But if you made the Matt Walsh blog y axis scale the same “zoom” as the y axis in the Galloblog figure, they look pretty similar. The only real difference here is in the overall happiness level of Galloblog and Matt Walsh blog readers – not the effect of reading the blog. Surprise, surprise! 😉
Finally, let’s talk very briefly about the label of the y axis. The y label is “Happiness Factor (AU).” What is a “happiness factor” – is it a legit scale that many other researchers have used to evaluate happiness, or did Galloblog researchers pull it out of their bootays?
AU usually means arbitrary units, which means this scale isn’t linked to an observable measurement per se (e.g. “number of times smiled”) but is a relative scale. This doesn’t mean it’s not worth noting, but it does mean you should be asking “what is this happiness relative to?”
Okay — that is all the lecturing either of us could handle for right now. Stay tuned for more opportunities to become a sophisticated critic of all data!
xoxoxo,
cgallo, PhD
— EDITORIAL NOTES —
No Galloblog readers were harmed in the writing of this article.
